Use a graphing utility to graph the function over the indicated interval and approximate any local maxima and local minima. Determine where the function is increasing and where it is decreasing. If necessary, round answers to two decimal places.f(x) = x3 - 4x2 + 6; (-1, 4)
A. local maximum at (0, 6)
local minimum at (2.67, -3.48)
increasing on [-1, 0] and [2.67, 4]
decreasing on [0, 2.67]
B. local maximum at (0, 6)
local minimum at (2.67, -3.48)
increasing on [0, 2.67]
decreasing on [-1, 0] and [2.67, 4]
C. local maximum at (2.67, -3.48)
local minimum at (0, 6)
increasing on [0, 2.67]
decreasing on [-1, 0] and [2.67, 4]
D. local maximum at (2.67, -3.48)
local minimum at (0, 6)
increasing on [-1, 0] and [2.67, 4]
decreasing on [0, 2.67]
Answer: A
You might also like to view...
Find the exact value of y, or state that y is undefined.y = cos-1 (-4)
A. ? B. undefined C. 0 D. -4
Find the expected value.A car agency has found daily demand to be as shown in the table. Find the expected number of customers.
A. 9 B. 12 C. 10 D. 2
Solve.Roger agreed to 8 years of car payments. He has been making payments for  and
and  How much longer does he have to keep making payments?
A. 4 yr 9 mo B. 4 yr 2 mo C. 4 yr D. 4 yr 10 mo
Use the given table to find the indicated probability.College students were given three choices of pizza toppings and asked to choose one favorite. The following table shows the results.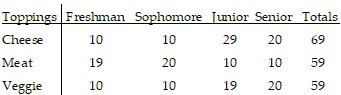 A student is selected at random. Find the probability that the student's favorite topping is veggie given that the student is a junior or senior.
A. 0.661 B. 0.361 C. 0.328 D. 0.209