Refer to the information provided in Figure 5.7 below to answer the question(s) that follow.
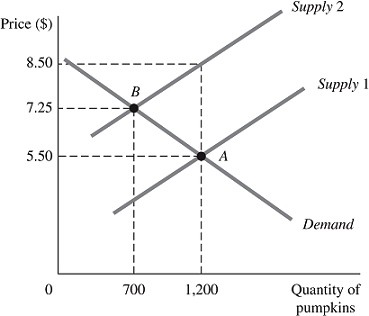 Figure 5.7The above figure represents the market for pumpkins both before and after the imposition of an excise tax, which is represented by the shift of the supply curve.Refer to Figure 5.7. The amount of the tax is ________ per pumpkin.
A. $1.25
B. $1.75
C. $3.00
D. $7.25
Answer: C
Economics
You might also like to view...
The working-age population is divided between those people in the labor force and those people unemployed
Indicate whether the statement is true or false
Economics
For almost 70 years international trade policies have been governed
A) by the World Trade Organization. B) by the International Monetary Fund. C) by the World. D) by an international treaty known as the General Agreement on Tariffs and Trade (GATT). E) by the North American Free Trade Agreement (NAFTA).
Economics
Which of the following is a behavioral implication of bounded rationality?
A) unbounded selfishness B) a rule of thumb C) a rational mistake D) a nervous breakdown
Economics
Marginal analysis of a 'one thing' decision
What will be an ideal response?
Economics