Make a line graph of the data.The following table gives the average cost of producing a music video over the given years. Use time on the horizontal scale for your line graph.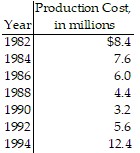
What will be an ideal response?
Answers may vary. A possible answer follows.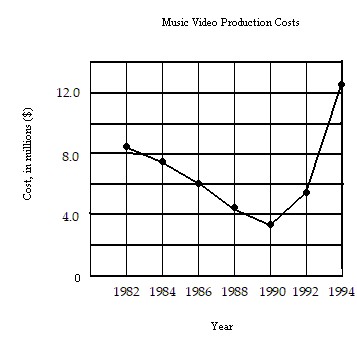
You might also like to view...
Solve the problem.The pulse rate for a species of small mammal follows a normal distribution with a mean  beats per minute and standard deviation
  beats per minute. In a population of 1000 of these mammals, how many would you expect to have a pulse rate between 193 and 249?
A. ? 480 of these mammals B. ? 540 of these mammals C. ? 690 of these mammals D. ? 500 of these mammals
Solve.How long will it take for the population of a certain country to double if its annual growth rate is 0.6%? Round to the nearest year. Use the exponential growth model 
A. 116 yr B. 50 yr C. 333 yr D. 1 yr
Simplify the expression. ?
? 
A. 3
B. 
C. 5
D. 3
Explain what we mean by indirect reasoning. ?
A. 
B. 
C. 
D. 
E. none of these