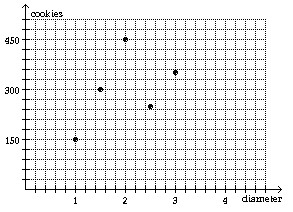
Provide an appropriate response.The table shows the number of cookies sold at a bake sale according to their diameter in inches. Write the ordered pair data as an ordered pair of the form (diameter, number sold). Then create a scatter diagram of the ordered pairs. Do the paired data show a trend. If so, what is the trend?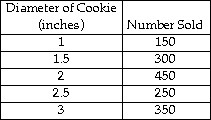
What will be an ideal response?
 ? ? |  |
Mathematics
You might also like to view...
Find the extreme values of the function subject to the given constraint.

A. Maximum: 32 at  minimum: -16 at
B. Maximum: 16 at  minimum: -16 at
C. Maximum: 32 at  minimum: -32 at
D. Maximum: 16 at  minimum: -32 at
Mathematics
Solve the problem.Suppose there are 5 roads connecting town A to town B and 3 roads connecting town B to town C. In how many ways can a person travel from A to C via B?
A. 8 ways B. 25 ways C. 9 ways D. 15 ways
Mathematics
The function f is one-to-one. Find its inverse.f(x) =
A. f-1(x) = x + 2
B. f-1(x) = 
C. f-1(x) = x3 + 2
D. f-1(x) = x3 + 4
Mathematics
Find the asymptotes of the hyperbola.25y2 - 49x2 - 1225 = 0
A. y = ±  x
x
B. y = ±  x
x
C. y = ±  x
x
D. y = ±  x
x
Mathematics