The bar graph shows the number of new residents in several towns during the years 1999 to 2001. Use the graph to answer the question. 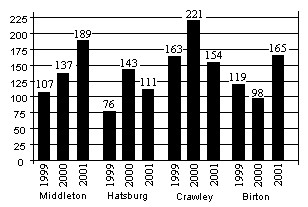 Of the total number of new residents in Hatsburg during the period 1999-2001, what fraction arrived in the year 2000?
A. 
B. 
C. 
D. 
Answer: D
You might also like to view...
Determine if the piecewise defined function is differentiable at the origin.f(x) = 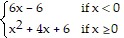
A. Not differentiable B. Differentiable
Provide an appropriate response.The annual interest paid on a bond is equal to the face value of the bond:
A. multiplied by the stated annual interest rate B. plus the stated annual interest rate C. minus the stated annual interest rate D. divided by the stated annual interest rate
Find the equilibrium values for B and F.
Chemicals enter a house’s basement air. Let F (t ) and B(t ) be the amount of chemical (in mg m3 ) in the first floor air and the basement air after t minutes, respectively. Let’s suppose that the rate of change of F and B are given by the equations: B'= -0.012 + 0.12 and F' = 0.015 - 0.02F What will be an ideal response?
Factor the polynomial.49k2 - 169m2
A. (7k + 13m)(7k - 13m) B. (7k - 13m)2 C. (49k + m)(k - 169m) D. (7k + 13m)2