Use the graph below, which shows the average number of weekly viewers of a 30-minute television program (in millions of viewers) from 2000 to 2006.
 figure 1.png)
List the set of years such that the average number of weekly viewers was larger than 5 million but less than 15 million.
a. {2000, 2001, 2002, 2003, 2004, 2005, 2006}
b. {2001, 2004, 2006}
c. {2004, 2006}
d. null set
e. {2004}
b. {2001, 2004, 2006}
You might also like to view...
Solve the quadratic equation. Write the answer in simplest form. 2 =
2 = 
A. 
B. 
C. 
D. 
For the given graph: a) In words, describe the function shown on the graph. b) Find the slope of the graph and express it as a rate of change (be sure to include units). c) Briefly discuss the conditions under which a linear function is a realistic model for the given situation.
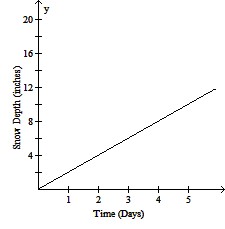
What will be an ideal response?
State whether the given relation is a function.Consider the relation whose domain is all students attending Laughlin Community College and whose range values are a set of the students' Social Security numbers. Is this relation a function?
A. Yes B. No
Multiply, then simplify the product. Assume that all variables represent positive real numbers.(5 - 3 )2
)2
A. 25 - 9
B. 25 + 9
C. 70 - 30
D. 70 + 30