Refer to the information provided in Figure 2.4 below to answer the question(s) that follow.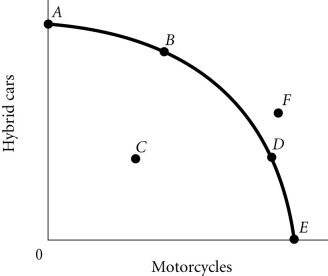 Figure 2.4According to Figure 2.4, a decrease in unemployment may be represented by the movement from
A. B to A.
B. C to D.
C. B to D.
D. A to C.
Answer: B
You might also like to view...
Since air pollution creates a negative externality,
a. social welfare will be enhanced when some, but not all air pollution is eliminated. b. social welfare is optimal when all air pollution is eliminated. c. governments should encourage private firms to consider only private costs. d. the free market result maximizes social welfare.
Describe how the marginal utility graphs for the hamburgers and milkshakes would compare for the \ data in the table. Be sure to note whether the slope of each graph would be positive or negative, whether it would approximate a curve or a straight line, and if either graph is steeper
What will be an ideal response?
In a market system, relative scarcities of resources are indicated by
A. surpluses. B. relative market prices. C. supply and demand being out of equilibrium. D. excess demand and excess supply.
"NAFTA" stands for:
A. North African Free Trade Area. B. North American Free Trade Agreement. C. North Asian Free Trade Agreement. D. New Zealand-Australia Free Trade Agreement.