Refer to the graph shown.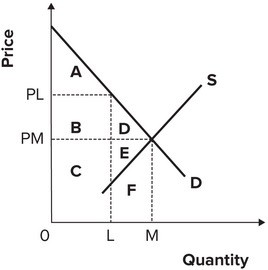 If suppliers can reduce output from M to L, the remaining firms in the market that are still producing L will find that their revenues will rise by:
A. area A, B, and C.
B. area B.
C. area A, B, and D.
D. area A.
Answer: B
You might also like to view...
Assume that the graphs show a competitive market referenced in the question below.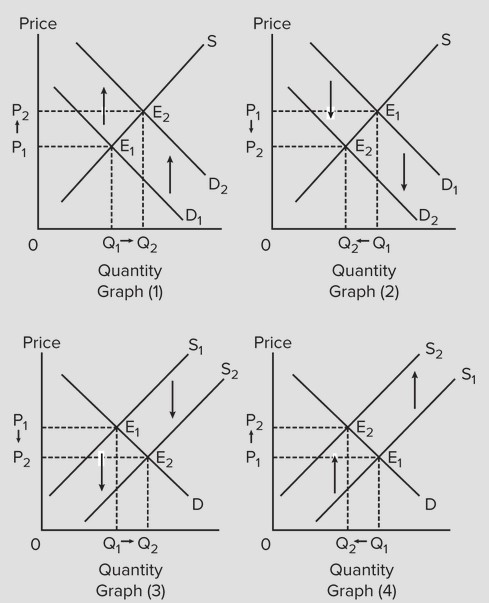 Select the graph that best shows the change in the market following a tax placed on the buyers in the market.
A. graph (1) B. graph (2) C. graph (3) D. graph (4)
When the yuan per dollar real exchange rate appreciates:
A) the U.S. net exports to China increase while the Chinese net exports to U.S. decrease. B) both the U.S. net exports to China and the Chinese net exports to the U.S. decrease. C) the U.S. net exports to China decrease while the Chinese net exports to U.S. increase. D) both the U.S. net exports to China and the Chinese net exports to the U.S. increase.
At the Nash equilibrium of an oligopoly market:
A. only one firm is able to earn profits. B. each firm is making a profit-maximizing choice, regardless of the choices of its rivals. C. each firm is making a profit-maximizing choice given the choices of its rivals. D. each firm produces the same quantity.
The Mincer earnings function is used to estimate
A. ability bias. B. the age-earnings profile. C. the value of the marginal product of labor. D. the social return to schooling. E. the signaling effect.