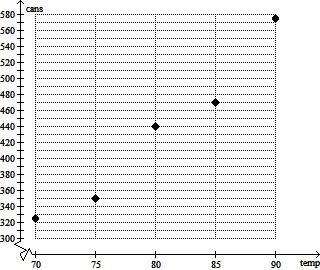
Solve.The table gives the number of cans of soda sold at a campus stand on five days with different high temperatures for the day. Write this data as a set of ordered pairs of the form  Then create a scatter diagram of the data.
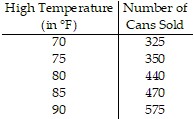
What will be an ideal response?
 ? ? |  |
Mathematics
You might also like to view...
Determine whether the values in the table belong to an exponential function, a logarithmic function, a linear function, or a quadratic function.
A. quadratic B. linear C. exponential D. logarithmic
Mathematics
Multiply.(-19.3)(-3.3)
A. 636.9 B. 0.6369 C. 63.69 D. 6.369
Mathematics
Simplify the expression. Assume that all variables are positive and write your answer in radical notation. ?
? 
A. 
B. 
C. 
D. 
Mathematics
X is Binomial(2, 0.6).
Find E ( X ), Var ( X ), and SD( X ) for the given random variable
Mathematics