Solve the problem.The chart below shows the profit-volume graphs of a single-product company for 1995 and 1996. Assume that unit sales prices were identical in both years. How did the fixed costs and unit variable costs in 1996 compare with those in 1995?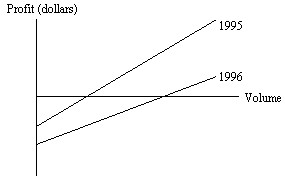
What will be an ideal response?
Both the fixed costs and the unit variable costs were higher in 1996 than in 1995.
You might also like to view...
Evaluate the expression.(-4)-1
A. -4
B. - 
C. 
D. 4
Complete the income statement. Camelot Sales Inc. had gross sales of $3,390,000 with returns of $68,500. The inventory on January 1 was $556,000. During the year $1,056,000 worth of goods was purchased with freight of $5100. The inventory on December 31 was $510,000. Wages and salaries were $83,000, rent was $11,200, advertising was $10,600, utilities were $6700, business taxes totaled $8100, and miscellaneous expenses were $8400.
A. 1) $3,390,000, 2) $68,500, 3) $3,321,500, 4) $1,107,100, 5) $2,214,400, 

B. 1) $3,390,000, 2) $68,500, 3) $3,321,500, 4) $1,107,100, 5) $2,214,400, 

C. 1) $3,390,000, 2) $68,500, 3) $3,458,500, 4) $1,107,100, 5) $2,351,400, 

D. 1) $3,390,000, 2) $68,500, 3) $3,321,500, 4) $1,096,900, 5) $2,224,600, 

Use the given conditions to find an equation in slope-intercept form of each of the nonvertical lines. Write vertical lines in the form x = h.m = -  ; y-intercept = 5
A. y = -  x + 5
x + 5
B. y =  x - 5
x - 5
C. y =  x + 5
x + 5
D. y = -  x - 5
x - 5
The graph of a function is given. Determine whether the function is increasing, decreasing, or constant on the given interval.[-1, ?)
A. constant B. increasing C. decreasing