This graph depicts the demand for a normal good. 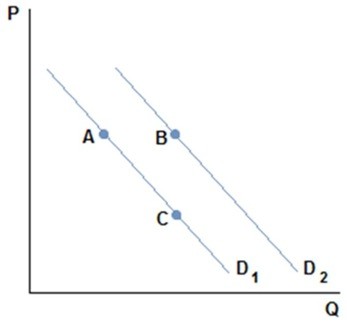 A shift from A to B in the graph shown might be caused by:
A. an increase in the good's price.
B. a decrease in the price of a complement.
C. a decrease in the price of a substitute.
D. an increase in the price of a complement.
Answer: B
You might also like to view...
In the United States, sole proprietorship profits are taxed at the business level and then are taxed again as personal income in the form of dividend payments
Indicate whether the statement is true or false
If wealth increases, the demand for stocks ________ and that of long-term bonds ________, everything else held constant
A) increases; increases B) increases; decreases C) decreases; decreases D) decreases; increases
Comparing the distribution of wealth of the wealthiest 1% of the population in the United States before and after the recent Great Recession to what occurred before and after the Great Depression,
A) the percentage of the wealth of the wealthiest 1% increased after the recent Great Recession, unlike what happened after the Great Depression B) the percentage of the wealth of the wealthiest 1% increased after the recent Great Recession, similar to what happened after the Great Depression. C) the percentage of the wealth of the wealthiest 1% declined after the recent Great Recession, unlike what happened after the Great Depression. D) the percentage of the wealth of the wealthiest 1% declined after the recent Great Recession, similar to what happened after the Great Depression.
In the long run, in a monopolistically competitive market, price will be
A) equal to MR. B) equal to MC. C) greater ATC. D) equal to ATC.