Refer to the information provided in Figure 2.5 below to answer the question(s) that follow.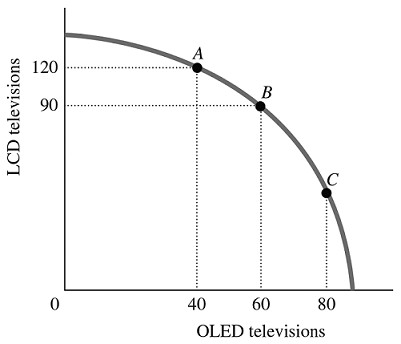 Figure 2.5Refer to Figure 2.5. For this economy to move from Point A to Point B, ________ additional OLED TVs could be produced when the production of LCD TVs is reduced by 30.
A. exactly 20
B. more than 20
C. fewer than 20
D. exactly 90
Answer: A
You might also like to view...
The above figure shows the market for laptops. Which of the following shifts the supply curve from S0 to S1?
A) an increase in the cost of hard drives B) a decrease in the price of laptops C) an increase in the number of laptop manufactures and sellers D) an increase in the price of laptops E) an increase in the productivity of the workers manufacturing laptops
During the 1990s, which of the following experienced the slowest rate of growth in real GDP per person?
A) Japan B) The big 4 nations of Europe C) United States D) Canada
If a regression coefficient passes the t-test, it means that
A) the regression equation is valid. B) the regression coefficient is significantly different from zero. C) the regression coefficient can be used for forecasting. D) the regression coefficient should be included in the regression equation.
Appendix: When using a multiplicative power function (Y = a X1b1X2b2X3b3) to represent an economic relationship, estimates of the parameters (a, and the b's) using linear regression analysis can be obtained by first applying a ____ transformation to convert the function to a linear relationship
a. semilogarithmic b. double-logarithmic c. reciprocal d. polynomial e. cubic