Provide an appropriate response.Graph y = sin-1(sin x). Explain why the graph looks like it does.
What will be an ideal response?
When plugging in angles such that -  ? x ?
? x ?  the output is the same angle. However, the range of
 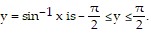 Therefore, when plugging in angles outside of that interval the output will be different. Instead of getting back the same angle you are getting back the first or fourth quadrant angle whose sine is the same value. The overall result is a function going back and forth between 1 and -1 in a linear fashion.
You might also like to view...
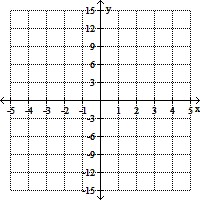
Solve the system of equations by graphing.

A. no solution B. (1, -2) C. (-1, 2) D. (-2, 1)
The data table has been generated by a linear, quadratic, or cubic function f. All zeros of f are real numbers located in the interval  By making a line graph of the data, conjecture the degree of f.
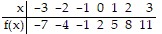
A. 1 B. 2 C. 3 D. 4
Decide if the number is rational or irrational. ?
A. Rational B. Irrational
Solve the problem using the information given in the table and the last- in, first-out inventory method. Round dollar amounts to the nearest cent.Determine the unit costs for units in the ending inventory. 57 units are in the ending inventory from the units that were purchased first. Beginning inventory: 90 units at $33.82 March 8: 70 units at $28.11 June 10: 65 units at $37.51 August 12: 40 units at $21.08
A. First purchases: 57 units @ $28.11 per unit B. First purchases: 57 units @ $33.82 per unit C. First purchases: 57 units @ $21.08 per unit D. First purchases: 40 units @ $33.82 per unit