Using the data given in Table 8.2, plot the temperatures for these three cities and portray with a smooth curved line graph on the temperature graph in Figure 8.3. Calculate the average annual temperature and temperature range for each city.
Trondheim, Norway
Avg. Annual Temperature (°C, °F): __________________
Annual Temp. Range (C°, F°): __________________
Ukhta, Russia
Avg. Annual Temperature (°C, °F): __________________
Annual Temp. Range (C°, F°): __________________
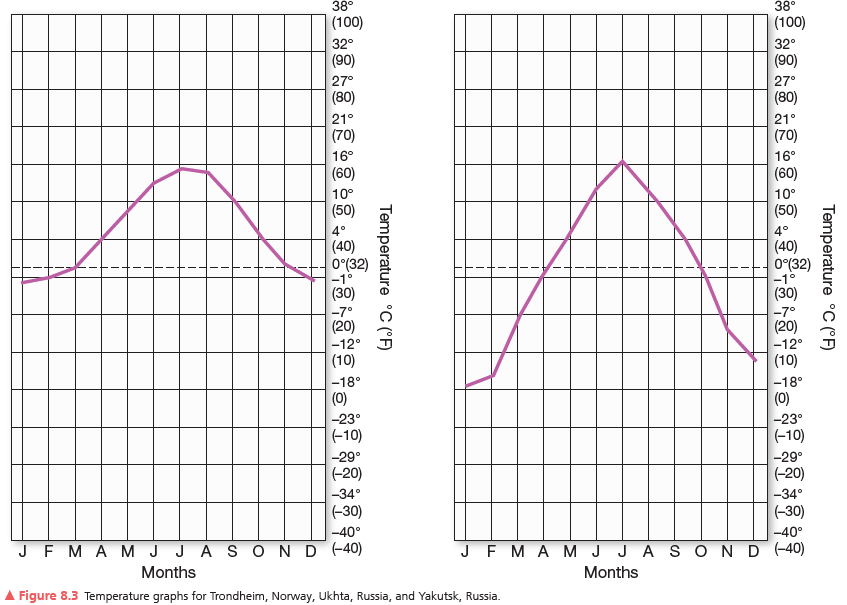
Left Trondheim, Norway, Right Ukhta, Russia
Trondheim, Norway
Avg. Annual Temperature (°C, °F): 5.8°C (42.4°F)
Annual Temp. Range (C°, F°): 16.9°C, (30.4°F)
Ukhta, Russia
Avg. Annual Temperature (°C, °F): 0.4°C (31.3°F)
Annual Temp. Range (C°, F°): 33.0°C, (59.4°F)
You might also like to view...
Rapid cooling of Earth's climate can be caused by ________.
A. plate tectonics B. changes in Earth's orbit C. volcanic activity D. solar flares
The ____ of water helps cool the atmosphere
a. evaporation b. condensation c. conduction d. freezing
The portion of each meandering curve subject to the slowest water velocity undergoes aggradation. This results in a(n)
A) cutback. B) meander scar. C) point bar. D) neck. E) oxbow.
Which greenhouse gas traps 21 times more heat in the atmosphere than carbon dioxide?
A. Ozone B. Methane C. Nitrous oxide D. Water