Refer to the below graph. What is the area that represents the efficiency loss due to the tax?
The graphs below illustrate the market for a product on which an excise tax has been imposed by government.
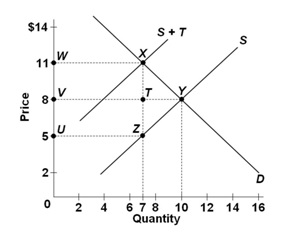
A. XYT
B. XYZ
C. WXZU
D. WXYZU
B. XYZ
You might also like to view...
A firm would find it profitable to increase its production when
a. its marginal revenue exceeds its marginal cost. b. its fixed costs decrease. c. higher resource costs raise its marginal costs. d. new competitors reduce the demand for the firm's product.
The beginning of the formal budget process is signified by:
a. in the form of the Economic Report of the President
b. in a report followed shortly by the Economic Report of the President.
c. at the beginning of the fiscal year.
d. in a report that should be voted up or down within 60 days.
e. in a report that requires a two-thirds vote for ratification.
Which of the following products has the most elastic demand?
A. Coca Cola in 12 oz. cans B. all cola drinks C. all carbonated beverages D. all beverages
When price is $2
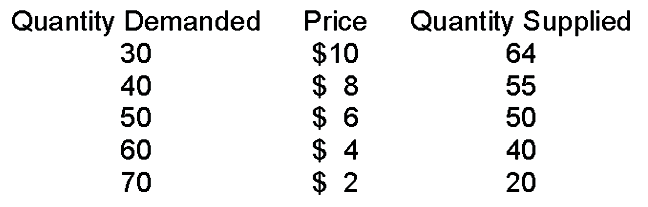
A. there is a surplus.
B. there is a shortage.
C. quantity demanded is less than quantity supplied.
D. price must fall to get to equilibrium.