Figure 36-1
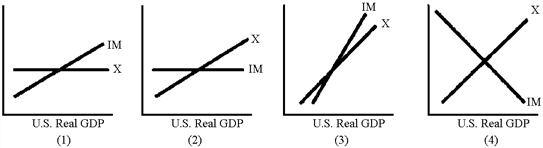
Which of the graphs in Figure 36-1 best illustrates the behavior of exports and imports in relation to U.S. real GDP?
A. 1
B. 2
C. 3
D. 4
Answer: A
You might also like to view...
Is the marginal benefit someone enjoys from a good or service the same as the price he or she pays? Explain your answer
What will be an ideal response?
Humana Hospital's price/marginal cost ratio of 2.3 is most likely to decline if
A) the number of nearby hospitals increases. B) the number of nearby hospitals decreases. C) the demand curve for hospital services shifts rightward. D) the demand curve for hospital services becomes steeper.
The following combinations of goods X and Y represent various market baskets. Consumption is measured in pounds per month
Market Basket Units of X Units of Y A 4 6 B 16 7 C 15 3 D 3 2 Explain which market basket(s) is(are) preferred to other(s), and if there is any uncertainty over which is preferable, point this out as well.
A food truck operator originally produced hamburgers and hotdogs. To serve the tastes of their various customers, the hot dog vendor decides to start producing turkey dogs and ham sandwiches as well. Since the new products were introduced, average costs rose dramatically. The vendor is experiencing
a. Economies of scale b. Economies of scope c. Diseconomies of scale d. Diseconomies of scope