Write a pair of parametric equations that will produce the indicated graph.The line segment starting at (6, -3) with t = 0 and ending at (18, -19) with 
A. x = -3t - 4, y = 6t + 3, for 0 ? t ? 4
B. x = -4t - 3, y = 3t + 6, for 0 ? t ? 4
C. x = 6t + 3, y = -3t - 4, for 0 ? t ? 4
D. x = 3t + 6, y = -4t - 3, for 0 ? t ? 4
Answer: D
You might also like to view...
Consider a geometric sequence that has initial term G0 = 75 and a common ratio c = 2.2.Find G1.
A. 155 B. 150 C. 35 D. 165 E. 144
Use the given information to answer the question.The population of a formerly endangered mouse is now on the rise. The population, N, over the last 8 years can be represented with the following graph.  When was the mice population the lowest?
A. Just before the end of the second year B. At the beginning of the 8 year period C. During the fifth year D. Just after the end of the third year
Test for relative maximum and minimum.
?
 ?
?
A. relative minimum at 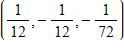
B. saddle point at 
C. saddle point at 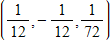
D. relative minimum at
E. saddle point at 
Find the location of the indicated absolute extremum for the function.Minimum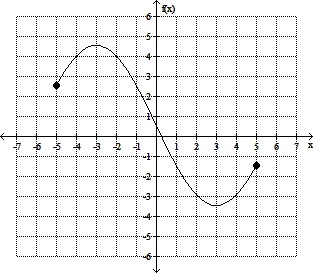
A. x = 3 B. x = -5 C. x = 5 D. x = -3