Provide an appropriate response.Suppose that you construct a frequency histogram and a relative frequency histogram corresponding to a particular frequency table. In what ways will the two histograms be similar? In what ways will they differ?
What will be an ideal response?
The two histograms will have the same shape. They will also have the same scale on the horizontal axis. They will differ only in the scales on the vertical axis: the frequency histogram will show frequencies on the vertical axis while the relative frequency histogram will show relative frequencies.
You might also like to view...
Use an increment of 0.02 to estimate the value of  at
at  if
if 
varid="variable_id_field" variablename="impvar_8fddb0954e354f7a8778f66ad" />. ? A. 0.0404 B. 2.02 C. 0 D. None of the above
Solve the equation graphically. Check your answer.x2 + 15x = 0
A. 0, -15
B. -1, 0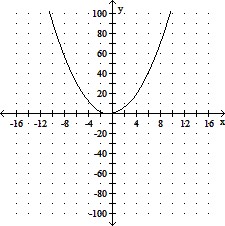
C. 0, 15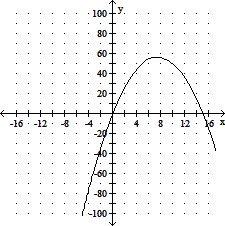
D. 0
Find the slope of the line passing through the pair of points: P (–1,–18); Q (13,16)
a. m = frac (17) (7) b. m = .frac (7) (17) c. m = frac (17) (7) d. m = .frac (7) (17) e. none of these
Factor the polynomial by grouping.2x4 - 3x2 + 4x2 - 6
A. (x + 2)(3x - 2) B. (x2 + 2)(2x2 - 3) C. (2x2 + 2)(x2 - 3) D. prime