Based on the figure below. Starting from long-run equilibrium at point C, an increase in government spending that increases aggregate demand from AD to AD1 will lead to a short-run equilibrium at point ________ creating _____gap. 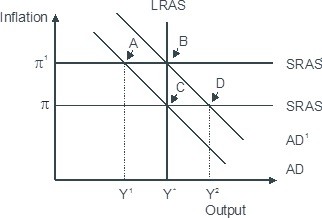
A. D; an expansionary
B. B; no output
C. B; expansionary
D. A; a recessionary
Answer: A
You might also like to view...
Refer to Table 3-2. The table above shows the demand schedules for caviar of two individuals (Ari and Sonia) and the rest of the market. At a price of $75, the quantity demanded in the market would be
A) 6 oz. B) 46 oz. C) 52 oz. D) 127 oz.
Suppose the real money demand function is Md/P = 2400 + 0.2Y - 10,000 (r + ?e). Assume M = 5000, P = 2.0, and ?e = .03. If Y were to increase from 4000 to 5000, then the real interest rate would increase by how many percentage points?
A) 2 B) 4 C) 5 D) 7
The Keynesian AS curve is
a. flat because of unemployed resources. b. vertical because of full employment. c. upward sloping. d. downward sloping.
Suppose that a hog-producing firm has been dumping its wastes into the local river. The government taxes the sale of hogs to pay for the cost of the river cleanup. As a result
a. more hogs are produced and the price falls b. more hogs are produced and the price increases c. fewer hogs are produced and the price falls d. fewer hogs are produced and the price increases e. quantity produced doesn't change but the price increases