Use the line graph to answer the question.The line graph shows the 2001 sales data for the Big "D" company. 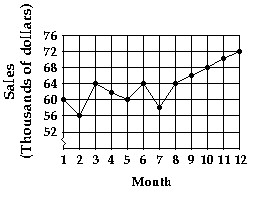 Which month had the lowest sales?
A. Month 3
B. Month 7
C. Month 5
D. Month 2
Answer: D
Mathematics
You might also like to view...
Find the focus and directrix of the parabola.x2 = -20y
A. (0, -5); x = 5 B. (0, -5); y = 5 C. (-5, 0); y = 5 D. (0, -5); y = -5
Mathematics
Solve the problem.Find the area of the region between the curve y = 4x/(1 + x2) and the interval  of the x-axis.
A. 4 e5 B. 0 C. ln 5 D. 4 ln 5
Mathematics
For the function find the maximum number of real zeros that the function can have, the maximum number of x-intercepts that the function can have, and the maximum number of turning points that the graph of the function can have. g(x) =  x7 + 3x2 - 9
A. 7; 7; 6 B. 7; 7; 7 C. 6; 6; 7 D. 7; 6; 5
Mathematics
Graph the function.f(x) = 3 - e-x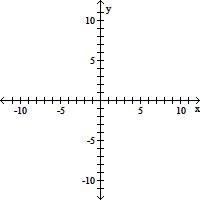
A. 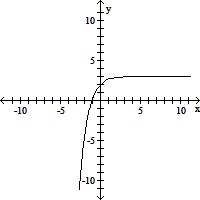
B. 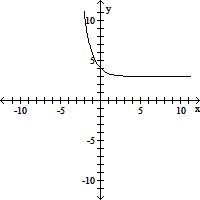
C. 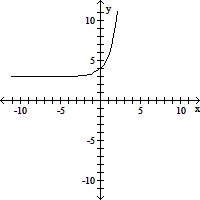
D. 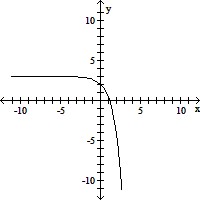
Mathematics