The aggregate demand is described graphically as
a. sloping downward.
b. a vertical line
c. a horizontal line.
d. sloping upward.
a
You might also like to view...
Refer to Game Matrix V. Which of the following values of X and Y result in the only Nash Equilibrium being (No, No) and there not being a Prisoners’ Dilemma?
a. X = 21, Y = 9. b. X = 19, Y = 11 c. X = 31, Y = 11. d. It is not possible for (No, No) to be a Nash Equilibrium and for there not to be a Prisoners’ Dilemma.
Refer to the figure shown, which represents the production possibilities frontiers for Countries A and B. Considering both country's production possibilities frontiers, we can infer that Country A will specialize in:
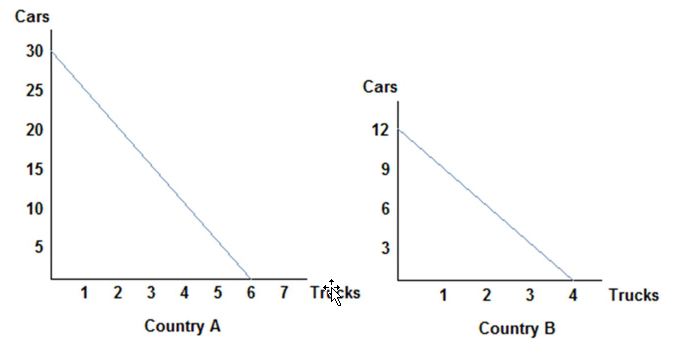
A. trucks, and be willing to accept no less than 5 cars for each truck.
B. cars, and be willing to give no more than 5 cars for each truck.
C. trucks, and be willing to accept no more than 5 cars for each truck.
D. cars, and be willing to give no less than 5 cars for each truck.
When the economy is experiencing a negative output gap:
A. some people and some capital are unemployed. B. the economy may be in a recession. C. there is little inflationary pressure due to low demand. D. All of these statements are true.
In 1950 there were approximately 7 working age people for every elderly person; however, in 2050 there will be
a. only 2.5 working people for every elderly person. b. only 5 working age people for every elderly person. c. 10 working age people for every elderly person. d. 14 working age people for every elderly person.