Graph the equation by plotting ordered pairs of numbers.y = -  (x - 5)2 - 4
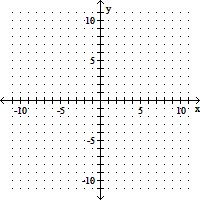
A. 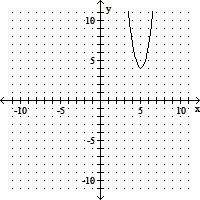
B. 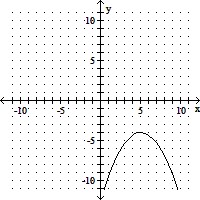
C. 
D. 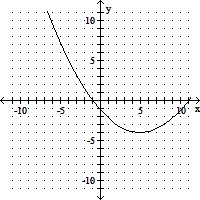
Answer: B
You might also like to view...
Use the graph to answer the question.The following chart shows the percentage of cigarette smokers in Gotham City. 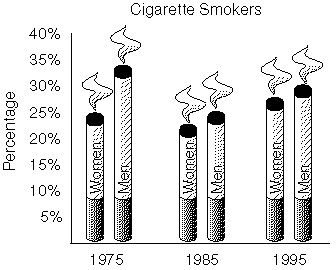 In which year does the percentage of men who smoke exceed the percentage of women who smoke by roughly 9 percentage points.
A. 1985 B. 1995 C. None of the above D. 1975
For the measured quantity, state the set of numbers that is most appropriate to describe it. Choose from the natural numbers, integers, or rational numbers.The number of cars sold in an average month at Bob's Auto Sales
A. Rational numbers B. Natural numbers C. Integers
Estimate the value of the quantity.The table gives dye concentrations for a cardiac-output determination. The amount of dye injected was  Plot the data and connect the data points with a smooth curve. Find the area under the curve using rectangles. Use this area to estimate the cardiac output.
 Time (sec)
 Dye concentration (mg/L)
A. 0.1 L/min B. 17.7 L/min C. 8.9 L/min D. 406.0 L/min
Solve the inequality. Graph the results.-10x - 4 ? -11x + 1![]()
A. x ? 5 ![]()
B. x < -10 ![]()
C. x > -10 ![]()
D. x ? 5![]()