Graph the function over a one-period interval.y =  cos 4
cos 4 
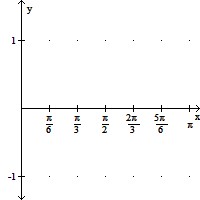
A. 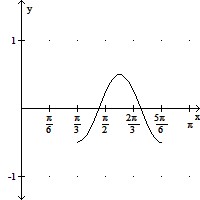
B. 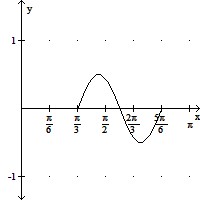
C. 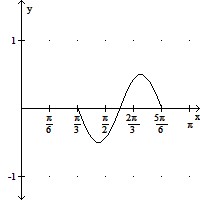
D. 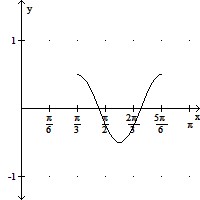
Answer: D
You might also like to view...
Solve. y2 + 2y = 15
A. -3, -5 B. 5, -3 C. 3, 5 D. 3, -5
Tell whether correlation is being used correctly. Identify any statistical errors.Pete obtained a high correlation between the number of churches in a city (x) and the number of homicides in the past decade (y) in the city. This suggests that when a city builds new churches, the number of homicides is likley to increase.
What will be an ideal response?
Use the Factor Theorem to determine whether x - c is a factor of f(x).5x3 + 12x2 - 8x - 3; x + 3
A. Yes B. No
The circle graph shows the results of the student council presidential election. The complete circular area represents 100% of the votes.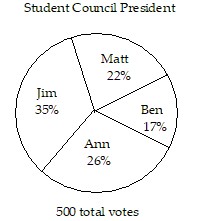 The circle graph shows what percent of the vote each person received.Find the ratio of Ben's votes to Matt's votes.
A. 
B. 
C. 
D. 