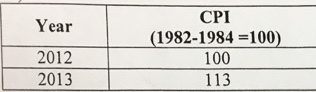
Refer to Table 13-9. Suppose that the data in the table above reflects the price levels in the economy. Given that data, we can say that the cost of living rose by ________ between 2012 and 2013?
a. 2%
b. 5%
?. 8%
d. 11%
e. 13%
Answer: e. 13%
Cost of living =( CPI_2013- CPI_2012)/CPI_2012
=( 113-100)/100
= 13%
You might also like to view...
Who is associated with the following summary of the economic way of thinking: "The theory of economics does not furnish a body of settled conclusions immediately acceptable to policy
It is a method rather than a doctrine, an apparatus of the mind, a technique of thinking which helps its processer draw correct conclusions." A) Adam Smith B) John Maynard Keynes C) President Harry Truman D) Alfred Marshall
Refer to Figure 18-9 to answer the following questions
a. Did the distribution of income become more equal in 2016 that it was in 2015, or did it become less equal? Explain. b. If area A = 1,600, area B = 200, and area C = 3,200, calculate the Gini coefficient for 2015 and the Gini coefficient for 2016.
In the ________ range of the aggregate supply curve, expansionary fiscal policy causes aggregate ________ to increase, which results in a higher price level and a higher equilibrium level of real GDP
a. intermediate, demand b. classical, demand c. Keynesian, supply d. intermediate, supply
Nominal gross private domestic investment was $1888.0 billion in 2008 and rose to $2057.4 billion in 2009. The chain-weight price index for gross private domestic investment was 106.6 for 2008 and 110.3 for 2009, where 2005 was the base year. Calculate the percent change in real gross private domestic investment (rounded to the nearest percentage point) from 2008 to 2009.
A. 3% B. 4% C. 5% D. 1%