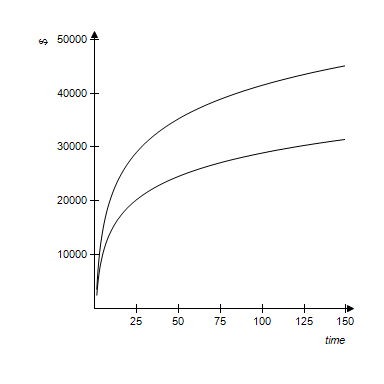
The following figure shows a graph that compares the present values of two ordinary annuities of $800 quarterly as functions of the number of quarters. One annuity is at an annual rate of 6% compounded quarterly, and the other is at an annual rate of 9% compounded quarterly. Use the graph below to estimate the difference between the present values of these annuities for 25 years (100 quarters).
?
?
A. $32,000
B. $4,500
C. $30,000
D. $100
E. $9,586
Answer: E
You might also like to view...
Add. Write the answer in lowest terms.
A. 29
B. 27
C. 28
D. 8
Determine independence. Answer Yes or No.The table shows the political affiliation of voters in one city and their positions on stronger gun control laws. ?Stronger Gun Control 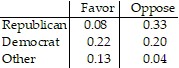 Are party affiliation and position on gun control laws independent?
A. Yes B. No
Translate to an inequality.The perimeter is greater than 249.
A. x ? 249 B. x > 249 C. x ? 249 D. x < 249
Set up the linear programming problem.An office manager is buying used filing cabinets. Small file cabinets cost $5 each and large file cabinets cost $11 each, and the manager cannot spend more than $73 on file cabinets. A small cabinet takes up 7 square feet of floor space and a large cabinet takes up 10 square feet, and the office has no more than 86 square feet of floor space available for file cabinets. The manager must buy at least 7 file cabinets in order to get free delivery. Let x = the number of small file cabinets bought and y = the number of large file cabinets bought. Write a system of inequalities that describes these constraints.
A. 5x + 11y ? 73 7x + 10y ? 86 y ? 7 B. 5x + 11y ? 73 10x + 7y ? 86 x ? 7 C. 5x + 11y ? 73 7x + 10y ? 86 x + y ? 7 D. 5x + 11y ? 73 7x + 10y ? 86 x + y ? 7