The graph below shows the percentage of students enrolled in the College of Engineering at State University. Use the graph to answer the question.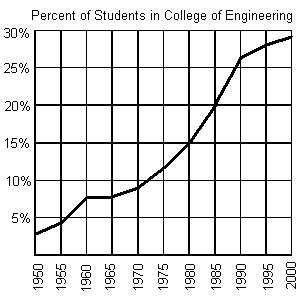 Does the graph represent a function?
A. yes
B. no
Answer: A
Mathematics
You might also like to view...
Find the divergence of the field F.F = -8xz3i + 2yj + 2z4k
A. 2 B. -8z3 + 2 C. -16z3 D. -16z3 + 2
Mathematics
Approximate the coordinates of the points.
?
A. ?A: (4, 2), B: (-6, -6), C: (5, 2), D: (6, -5) B. ?A: (1, 2), B: (-6, -6), C: (5, 2), D: (6, -5) C. ??A: (2, 2), B: (-6, -6), C: (5, 2), D: (6, -5) D. ??A: (3, 2), B: (-6, -6), C: (5, 2), D: (6, -5) E. ???A: (-1, 2), B: (-6, -6), C: (5, 2), D: (6, -5)
Mathematics
Find the least common multiple of the denominators of the fractions. ,
, 
A. 525 B. 33,075 C. 2205 D. 124,425
Mathematics
Perform the indicated operation.v = -4i + 6j + 3k and w = 6i - 2j + 3kFind 3v + 4w.
A. 12i + 10j + 21k B. 2i + 4j + 6k C. 20i - 2j + 15k D. -6i + 16j + 12k
Mathematics