The following graph shows the monthly sales for Big "D" Sales during 2000 and 2001. Use the graph to solve the problem.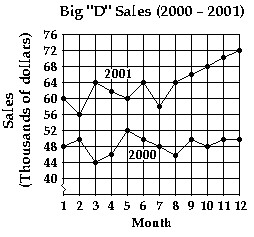 What was the total increase in sales from 2000 to 2001?
A. $12,000
B. $182,000
C. $22,000
D. $1,342,000
Answer: B
Mathematics
You might also like to view...
Evaluate to four decimal places using a calculator.e-3.92
A. 0.0219 B. -10.6557 C. 50.4004 D. 0.0198
Mathematics
Graph the function.y = -  sin
sin 
A. 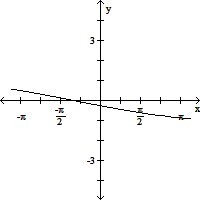
B. 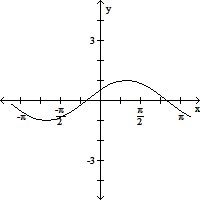
C. 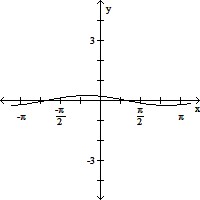
D. 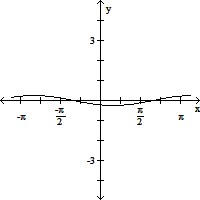
Mathematics
Write as the sum and/or difference of logarithms. Express powers as factors.log3
A. log3x - 2
B. - 2log3x
C. 6 -  log3x
log3x
D.  log3x - 2
Mathematics
Write the decimal number in standard form.Three hundred ninety-one thousandths
A. 0.00391 B. 0.0391 C. 0.391 D. 300.91
Mathematics