Solve the problem.The following graph shows the stock price of a new internet company over the first 18 months after the initial public offering of its stock.
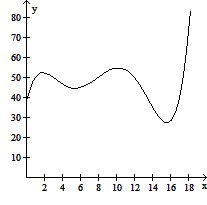 MonthApproximately in which month(s) did the stock price reach $70?
A. The price never reached $70.
B. The 18th month
C. The 10th and 18th months
D. The 2nd and 10th months
Answer: B
You might also like to view...
Solve the problem.An oil storage tank can be described as the volume generated by revolving the area bounded by 


 about the x-axis. Find the volume
  of the tank.
A. 30.6 m3 B. 153 m3 C. 0.874 m3 D. 1120 m3
Solve the problem.Suppose a brewery has a filling machine that fills 12 ounce bottles of beer. It is known that the amount of beer poured by this filling machine follows a normal distribution with a mean of  and a standard deviation of 0.04 ounce. Find the probability that the bottle contains between 12.08 and 12.14 ounces.
A. 0.8351 B. 0.8475 C. 0.1525 D. 0.1649
Multiply. Change any mixed number to an improper fraction before multiplying.4 ? 6
A. 27
B. 10
C. 24
D. 27
Find all solutions of the equation. Express the solution in radians.sec x = 
A. 2n? or ? + 2n?
B.  + 2n? or
  + 2n?
+ 2n?
C.  + 2n? or
  + 2n?
+ 2n?
D.  + 2n? or
  + 2n?
+ 2n?