Based on the graphic showing the Lorenz Curve, what would have happened if income distribution had been more equal in 2017?
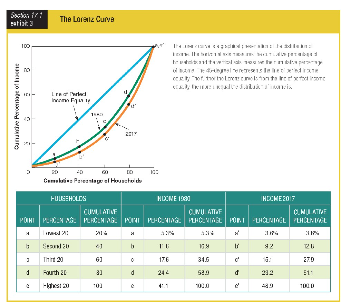
a. The line for perfect income equality would become curved.
b. The Lorenz curve for 2017 would become more curved.
c. The Lorenz curve for 2017 would become less curved.
d. The line for perfect income inequality would shift to the right.
c. The Lorenz curve for 2017 would become less curved.
You might also like to view...
Refer to the above table. Which variables in the table are NOT autonomous?
A) planned consumption and planned saving B) planned saving only C) taxes, government spending, and saving D) planned investment, net exports, and government spending
Under the U.S. system of regulation, most regulars are selected from
A) politicians and their friends. B) the industry that is to be regulated. C) consumer advocacy groups. D) university professors who understand the nature of the industry and who understand the true interests of consumers.
Prices communicate information about relative availability of products. For example, a decrease in the price of corn signals to consumers and producers that: a. consumers are buying more corn than before
b. corn is relatively more abundant than before. c. corn is relatively less abundant than before. d. consumers are stocking up on corn because of the predictions of a cold winter.
When actual output is less than potential output there is a(n):
A. trade deficit. B. budget deficit. C. recessionary gap. D. budget surplus.