Give an appropriate answer.The following table shows the average price per pound of seed from 2008 through 2012. 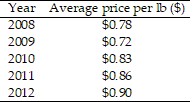 Draw a bar graph that makes the increase in the price look large.
What will be an ideal response?
Answers may vary. One possible solution: 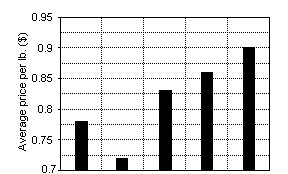
| 2008 | 2009 | 2010 | 2011 | 2012 |
| Year |
Mathematics
You might also like to view...
Solve the problem.The graph below shows the first derivative of a function  . Select a possible graph f that passes through the point P. f'
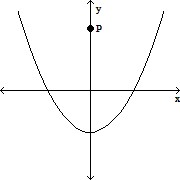
A. 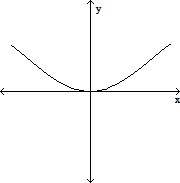
B. 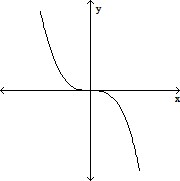
C. 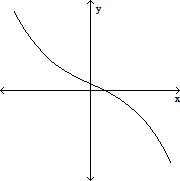
D. 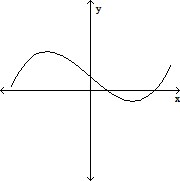
Mathematics
Provide an appropriate response.Determine the point elasticity ? of the demand equation p =  , where p > 0 and q > 0.
What will be an ideal response?
Mathematics
Solve.5y - 5 = 9 + 6y
A. 
B. 
C. 
D. 
Mathematics
Graph the equation.x = -2y2 + 5y - 3 
A. 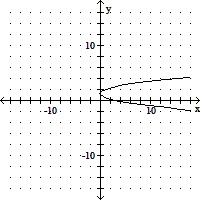
B. 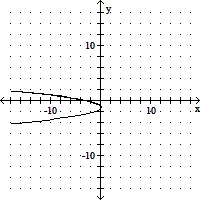
C. 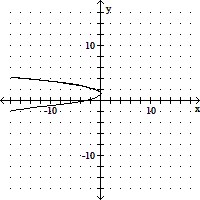
D. 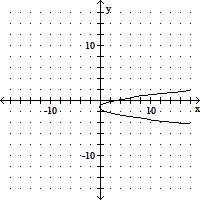
Mathematics