In the figure above, the richest 40 percent of households receive ________ of total income
A) 70 percent
B) 30 percent
C) 60 percent
D) 80 percent
A
You might also like to view...
In the above figure, if the price is P1 and the firm produced Q3, the firm's economic profit is ________ than if it produced Q1 and ________ than if it produced Q2
A) less; less B) less; more C) more; less D) more; more
If an increase in quantity demanded of a product reduces the quantity demanded of another, then the two goods are said to be substitutes.
Answer the following statement true (T) or false (F)
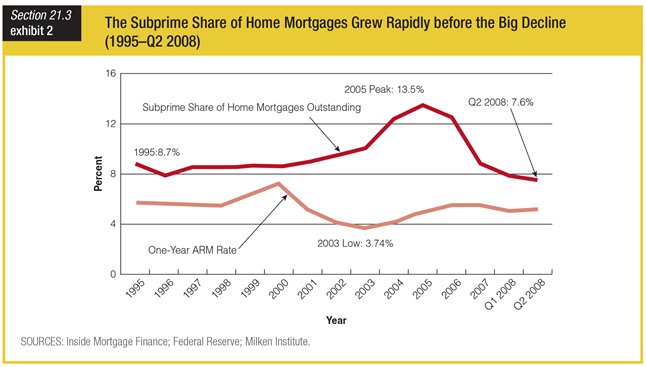
Based on the graph showing how the subprime share of home mortgages grew rapidly before the big decline, at the peak of the use of subprime loans in 2005, the gap between the share of subprime mortgages and adjustable mortgage rates was ______ the typical historical difference.
a. perfectly in line with
b. slightly smaller than
c. slightly greater than
d. dramatically greater than
The supply curve of money is horizontal at the market interest rate.
a. true b. false