The wages of the employees of a company are presented in this histogram. Answer the question. How many employees earn at least $4 and less than $6 an hour?
A. 10
B. 20
C. 34
D. 22
Answer: B
Mathematics
You might also like to view...
Graph the function.f(x) = (-2x + 1)(x + 2)(x - 1)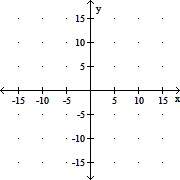
A. 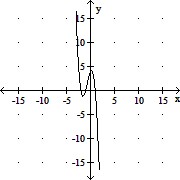
B. 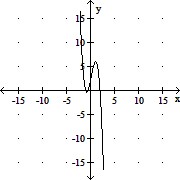
C. 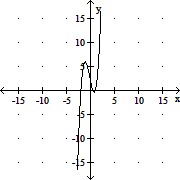
D. 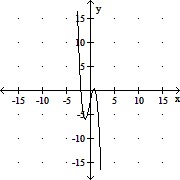
Mathematics
Graph the system of inequalities.y ? x2x + y > 5
A. 
B. 
C. 
D. 
Mathematics
Name the method that can be used to prove the triangles are congruent.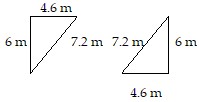
A. SAS B. The triangles are not congruent. C. ASA D. SSS
Mathematics
The pie chart gives the fraction of a company's total yearly sales by employee.?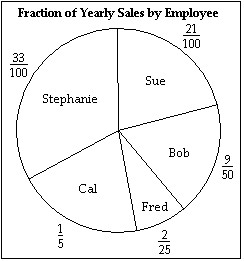 What percentage of yearly sales were attributed to Cal?
A. 33% B. 20% C. 21% D. 200%
Mathematics