Estimate the limit by graphing the function for an appropriate domain. Confirm your estimate by using l'Hopital's rule. Show each step of your calculation. x
x
What will be an ideal response?
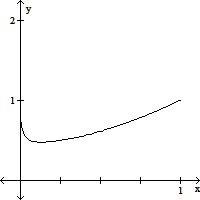
Using the graph, students should estimate the limit to be 1.
Using l'Hopital's rule:
the limit leads to the indeterminate form 00 so let f(x) = x and take logarithms of both sides
ln f(x) =  ln x =
 ln f(x) =


= 
 differentiate
=  -2
-2 = 0
= 0
So  x
x =
=  eln f(x) = e0 = 1
You might also like to view...
Which of the following is not equivalent to:? x - 5 = –12
A. ?x = –17 B. ?x = –7 C. ?x + 1 = –6 D. ?x - 9 = –16 E. ?x - 7 = –14 F. ?x + 5 = –2
Find the Cartesian coordinates of the given point.(-4, -?/3)
A. (-2 , -2)
, -2)
B. (-2 , 2)
, 2)
C. (-2, 2 )
)
D. (2, 2 )
)
Graph the solution set of the system of inequalities.

A. 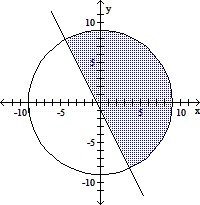
B. 
C. 
D. 
The graph shows a region of feasible solutions. Find the requested value or values of P over this region.Find the maximum and minimum ofP = 15x + 9y.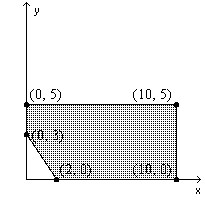
A. 150, 27 B. 45, 27 C. 195, 150 D. 195, 27