Refer to the information provided in Figure 2.5 below to answer the question(s) that follow.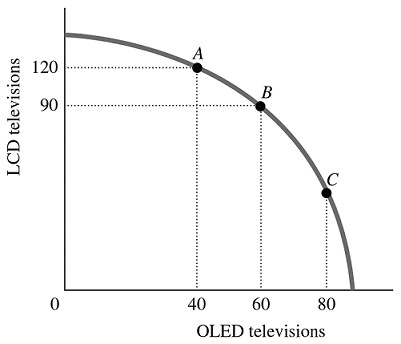 Figure 2.5Refer to Figure 2.5. The best point for society would be
A. either Point B or Point C, as the total amount being produced at either of these points is approximately the same.
B. at any of the labeled points, as all of the points represent an efficient allocation of resources.
C. Point C, as at this point there are approximately equal amounts of LCD and OLED televisions being produced.
D. indeterminate from this information, as we don't have any information about the society's desires.
Answer: D
You might also like to view...
How does moral hazard affect market outcomes?
If the MPC is 0.5, then the spending multiplier must be:
A. 2.25. B. 2.5. C. 2. D. 1.2.
The supply curve for one firm resembles ______.
a. an ellipse b. a staircase c. a pine tree d. a ski slope
If the value of the price elasticity of demand is 0.2, this means that:
A. a 20 percent decrease in price causes a 1 percent increase in quantity demanded. B. a 0.2 percent decrease in price causes a 1 percent increase in quantity demanded. C. a 5 percent decrease in price causes a 1 percent increase in quantity demanded. D. a 0.2 percent decrease in price causes a 0.2 percent increase in quantity demanded.