The graph shows the total sales in thousand of dollars from the distribution of x thousand catalogs. Find the average rate of change of sales with respect to the number of catalogs distributed for the change in x. 10 to 20
A. 
B. 1
C. 
D. 2
Answer: B
Mathematics
You might also like to view...
Write the decimal as a fraction in lowest terms.4.80
A. 
B. 
C. 
D. 
Mathematics
Graph the function using a graphing utility and the Change-of-Base Formula.y = log7x
A. 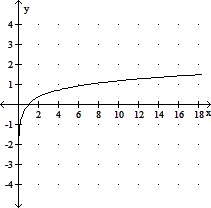
B. 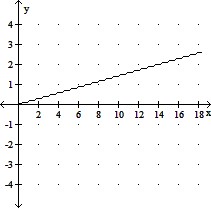
C. 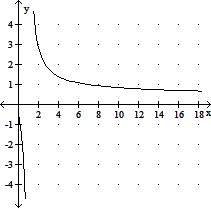
D. 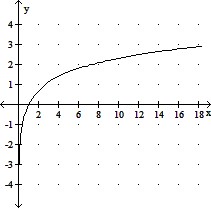
Mathematics
Identify the equation as a parabola, circle, ellipse, or hyperbola.6x2 = 25 - 6y2
A. Parabola B. Ellipse C. Hyperbola D. Circle
Mathematics
Graph the function using its vertex, axis of symmetry, and intercepts.f(x) = x2 + 8x + 16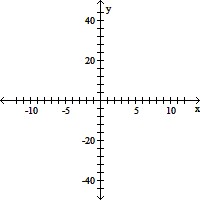
A. vertex (4, 16)
intercept (0, 32)
B. vertex (4, 0)
intercepts (0, 16), (4, 0)
C. vertex (-4, 16)
intercept (0, 32)
D. vertex (-4, 0)
intercepts (0, 16), (-4, 0)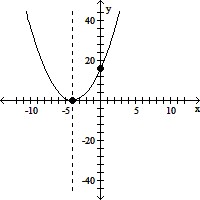
Mathematics