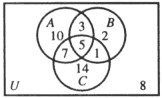
Draw a Venn diagram based on the information below and label each basic region with the number of elements in it.n(U) = 50, n(A) = 25, n(B) = 11, n(C) = 27, n(A ? B) = 8, n(A ? C) = 12, n(B ? C) = 6, and n(A ? B ? C) = 5.
What will be an ideal response?
You might also like to view...
Solve the system of equations graphically.Northwest Molded molds plastic handles with a production cost of $0.60 per handle to mold. The fixed cost to run the molding machine is $6372 per week. If the company sells the handles for $3.60 each, how many handles must be molded and sold weekly to break even?
A. 1416 handles B. 1517 handles C. 10,620 handles D. 2124 handles
Write as a percent. Round the percent to the nearest tenth if necessary.
A. 65.8% B. 170% C. 111.8% D. 11.2%
One zero is given. Find all others.P(x) = x3 + 7x2 - 3x - 21; -7
A. - , -
, - , -
, - , -
, -
B. - , -
, - , -3
, -3
C. - ,
, 
D. -3, 3
Find the three measures of central tendency (the mean, median, and mode). Round your answers to the nearest tenth, if necessary.0, 2, 2, 6, 8, 10, 11, 33Answer no mode if needed. mean =__________median =__________mode =__________
What will be an ideal response?