The figure below represents the effects in the labor markets due to migration. Here, the world has been divided into a high-income "North" (left panel) and a low-income "South" (right panel). Dn and Sn are the labor demand and the labor supply curves in North. Ds and (Sr + Smig) are the labor demand and pre-migration labor supply curves in South. Sr is the post-migration labor supply curve in South. The value c is the cost of migrating.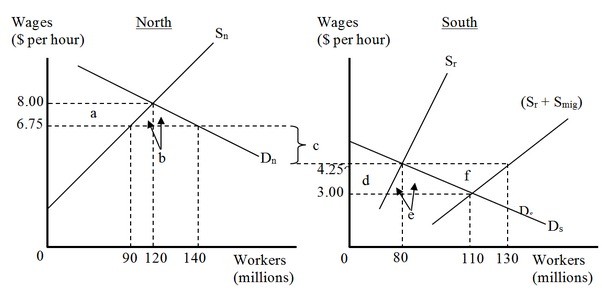 The migration cost on a per hour basis is
A. $2.50.
B. $1.25.
C. $4.25.
D. $6.75.
Answer: A
You might also like to view...
Product differentiation involves making a product that is
A) slightly different from the products of competing firms. B) no different than the products of competing firms. C) very different from the products of competing firms. D) completely different from the products of competing firms. E) cheaper than the products of competing firms.
Refer to Figure 2-2. The linear production possibilities frontier in the figure indicates that
A) it is progressively more expensive to produce meat. B) Mendonca has a comparative disadvantage in the production of meat. C) the tradeoff between meat and vegetables is constant. D) Mendonca has a comparative advantage in the production of vegetables.
Why may potential savings in a developing economy be greater than they appear? How can poor people be encouraged to save through financial institutions?
What will be an ideal response?
Any point on a country's production possibilities frontier represents a combination of two goods that an economy
a. will never be able to produce. b. can produce using all available resources and technology. c. can produce using some portion, but not all, of its resources and technology. d. may be able to produce in the future with more resources and/or superior technology.