Provide an appropriate response.A pediatric speech therapist started her own practice in 2004. The table below shows the number of children she treated each year from 2004 to 2012. The data is to be aligned to the number of years past 2000 and fitted with a linear model. Classify each of the following as discrete or continuous.i) The data in the tableii) A scatter plot made from the dataiii) The best-fit linear model obtained for the dataiv) The graph of the best-fit linear model obtained for the data
What will be an ideal response?
The data in the table and the scatter plot are discrete. The linear model and its graph are continuous.
You might also like to view...
Use the Binomial Theorem to expand the binomial.(x + 2)6
A. x6 + 12x5 + 60x4 + 160x3 + 240x2 + 192x + 64 B. x6 + 12x5 + 64x4 + 40x3 + 64x2 + 12x + 2 C. x6 + 12x5 + 48x4 + 144x3 + 192x2 + 192x + 64 D. x6 + 12x5 + 24x4 + 36x3 + 24x2 + 12x + 2
Decide whether the equation is an identity, a conditional equation, or a contradiction. Give the solution set.-2(x + 7) + (-5x) = -7(x - 7) + 5
A. Contradiction; ? B. Identity; {all real numbers} C. Conditional; {0} D. Conditional; {5}
Add or subtract. Simplify by combining like radical terms, if possible. Assume all variables and radicands represent positive real numbers.9 - 7
- 7
A. 26
B. 2
C. -44
D. -26
Graph the inequality.y < -x - 4
A. 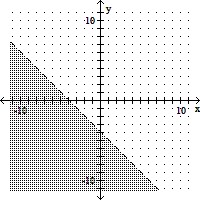
B. 
C. 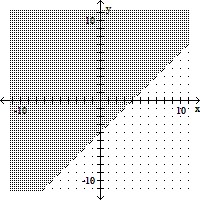
D. 