Refer to the information provided in Figure 2.4 below to answer the question(s) that follow.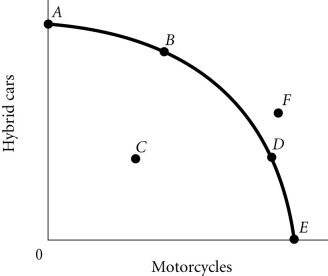 Figure 2.4According to Figure 2.4, a decrease in unemployment may be represented by the movement from
A. B to A.
B. C to D.
C. B to D.
D. A to C.
Answer: B
You might also like to view...
Refer to the figure below.________ inflation will eventually move the economy pictured in the diagram from short-run equilibrium at point ________ to long-run equilibrium at point ________. 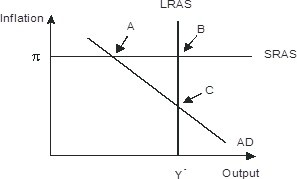
A. Rising; A B. Falling; A; C C. Falling; B: C D. Rising; A; C
Resources are all of the following EXCEPT
A) scarce and therefore require choices to be made. B) limited in quantity and can be used in different ways. C) unlimited and in abundance. D) the things we use to produce goods and services.
The above figure shows the market for pizza. The market is in equilibrium. Pizza and tacos are substitutes for consumers. The price of tacos falls. What point represents the most likely new price and quantity?
A) A B) B C) C D) D E) E
Explain how a technological advancement in one sector of the economy can lead to a change in the number of people who work in another sector of the economy. Give an example to help support your answer