Solve the problem.The following graph shows the stock price of a new internet company over the first 18 months after the initial public offering of its stock.
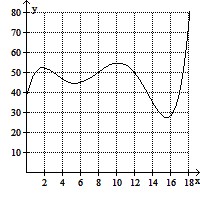 MonthApproximately in which month(s) did the stock price reach $60?
A. The 10th and 18th months
B. The price never reached $60.
C. The 18th month
D. The 2nd and 10th months
Answer: C
Mathematics
You might also like to view...
Find the exact value of the expression.sin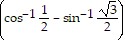
A. 1
B. 
C. 0
D. 
Mathematics
Solve.8|x| + 5 = 14
A. 
B. 
C. 
D. 
Mathematics
Use the fundamental identities and the given information to find the exact values of the remaining trigonometric functions of x.cot x = -  and sin x = -
A. cos x =  , tan x = -
  , csc x =
  , sec x = -
B. cos x = -  , tan x = -
  , csc x =
  , sec x =
C. cos x = -  , tan x =
  , csc x =
  , sec x = -
D. cos x =  , tan x = -
  , csc x = -
  , sec x =
Mathematics
Solve the equation.e2x - 1 = (e3)-x
A. 
B. 
C. {0}
D. 
Mathematics