Using Figure 1 above, if the aggregate demand curve shifts from AD2 to AD3 the result in the short run would be: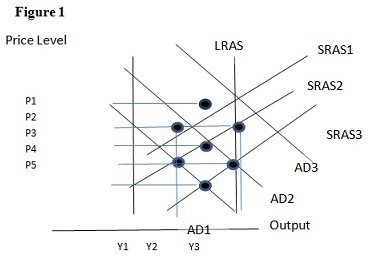
A. P1 and Y2.
B. P2 and Y3.
C. P3 and Y1.
D. P2 and Y2.
Answer: B
You might also like to view...
Explain how a change in tax rates influences aggregate demand and aggregate supply
What will be an ideal response?
A credit-driven bubble arises when ________ in lending causes ________ in asset prices which can cause ________ in lending
A) a decrease; a decrease; an increase B) a decrease; an increase; an increase C) an increase; an increase; a further increase D) a decrease; a decrease; a further decrease
All points inside the production possibilities curve indicate
A) a lack of sufficient supply. B) inefficiency in production. C) the law of increasing relative cost. D) the law of decreasing relative cost.
Auto dealers slash prices at the end of the model year in response to deficient demand/excess inventory but restaurants facing the same problem slash production because
a. auto customers are less price sensitive than restaurant customers b. price elasticity of demand (in absolute values) is higher for auto than restaurant customers c. price elasticity of supply is lower in auto than in restaurants d. restaurant food spoils quickly and is much more perishable e. price elasticity of supply in autos is smaller than the absolute value of price elasticity of demand but the reverse is true for restaurants