Use the graph to determine whether the data represent direct variation, inverse variation, or neither.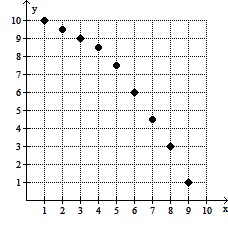
A. Neither
B. Direct
C. Inverse
Answer: A
Mathematics
You might also like to view...
Find the indicated partial sum for the given sequence.s8, 3, -5, 7, -9, . . .
A. 5 B. -8 C. 8 D. -5
Mathematics
Simplify.
A. 35
B. 7
C. 5
D. 15
Mathematics
Divide. Write the answer in simplest form. ÷
÷ 
A. 11
B. 10
C. 12
D. 
Mathematics
Begin by graphing the standard cubic function f(x) = x3. Then use transformations of this graph to graph the given function.g(x) = -  x3
x3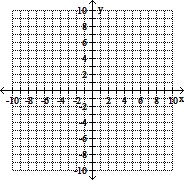
A. 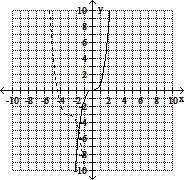
B. 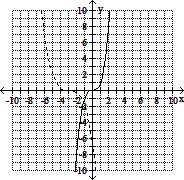
C. 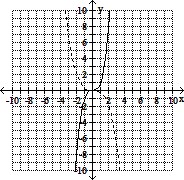
D. 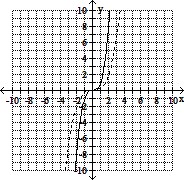
Mathematics