Solve by graphing. Label the axes and show where the solution is located on the graph.The graph depicts a relationship between scores achieved on an unspecified standardized test and family income. Suppose the score for a test is 480 when the family income is $25,000 and is 530 when the family income is $55,000. Let x be the income and y be the score of the test. Graph the two given pairs of incomes and scores. Assume that the relationship is linear. Draw a line though the two previous points. From your graph, estimates the score if the family income is $40,000.
A. 
555
B. 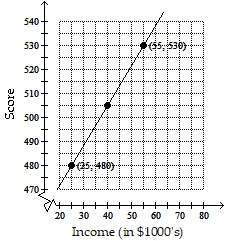
505
C. 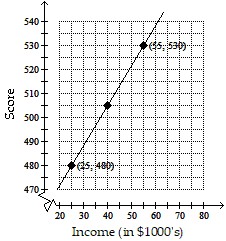
530
D. 
580
Answer: B
Mathematics
You might also like to view...
Solve.A 6-sided die is rolled. What is the probability of rolling a number less than 2?
A. 
B. 
C. 
D. 
Mathematics
Find the amount that will be accumulated in the account under the given conditions.The principal $15,400 is accumulated with simple interest of 16% for 5 years.
A. $15,892.80 B. $20,212.50 C. $27,720 D. $12,320
Mathematics
Find the solution set for the inequality.|4m + 5| + 9 ? 12
A. {m|- 2 ? m ? -  }
}
B. {m| ? m ? 2}
C. {m|m ? - 2 or m ? -  }
}
D. {m|m ?  or m ? 2}
Mathematics
Multiply.× 
A. 348.62 B. 60.7 C. 347.52 D. 347.63
Mathematics