The graph of the budget line below has dollars on the vertical axis and food on the horizontal axis. Which statement is false? 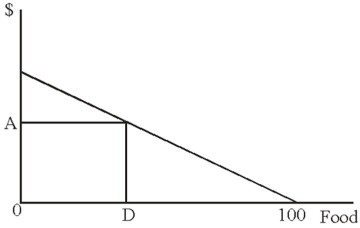
A. The vertical intercept represents all money available for purchasing.
B. The distance OA shows the amount of money spent on OD amount of food.
C. The horizontal intercept represents all the food the consumer could purchase with the budget available.
D. If the amount of money available is known in this graph, then the absolute and relative price of food is known also.
Answer: B
You might also like to view...
If a 30 percent change in price causes a 15 percent change in quantity supplied, then the price elasticity of supply is about
a. 0.5, and supply is elastic. b. 0.5, and supply is inelastic. c. 2, and supply is inelastic. d. 2, and supply is elastic.
In the production function Real GDP = T (L, K, NR, H), the T represents the _____________ coefficient, the L represents ________________, the K represents _______________, the NR represents natural resources, and the H represents ________________
A) tax; labor; capital; humanity B) technology; labor; knowledge; humanity C) technology; labor; capital; human capital D) trade; labor; knowledge; human capital
If a decrease in income results in an increase in the quantity demanded for a product, the product is ________, and the value of the income elasticity of demand is ________.
A. a normal good; positive B. a normal good, negative C. an inferior good; positive D. an inferior good; negative
Investments that are designed to match exactly the performance of a group of stocks like the Dow Jones Industrial Average or the S&P-500 are called:
A. Index funds B. Dividend funds C. Portfolio funds D. Capital gain funds