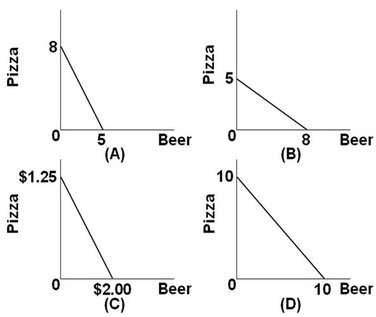
 Refer to the above graphs. Pizza and beer are the only two goods Jon consumes. The price of beer is $2.00 per pitcher and pizza is $1.25 per slice. If Jon has only $10 to spend for the evening, which graph represents the set of possible combinations of beer and pizza he can consume?
A. Graph A
B. Graph B
C. Graph C
D. Graph D
Answer: A
You might also like to view...
Which of the following is NOT an example of the hurdle method of price discrimination?
A. Offering a mail-in rebate. B. Charging less for airline tickets if the trip includes a Saturday night stayover. C. Permanently reducing all prices by 10%. D. Giving a discount on movie tickets to people with a student ID.
Suppose a bank has a desired reserve requirement ratio of 12 percent. If someone deposits $1,000 in the bank
A) immediately after the deposit, excess reserves increase by $880. B) the bank can make loans of $1,000. C) the bank's desired reserves rise by $1,000. D) Both answers B and C are correct.
According to the table shown, the firm's marginal costs:
This table shows the total costs for various levels of output for a firm operating in a perfectly competitive market.
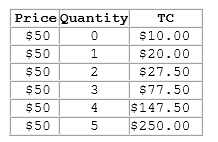
A. are constant.
B. increase as output increases.
C. decrease until the 2nd unit, then increase.
D. increase until the 4th unit, then decrease.
The elasticity formula solves the units problem because percentages are unaffected by the units of measure
a. True b. False Indicate whether the statement is true or false