Refer to the information provided in Figure 3.11 below to answer the following question(s).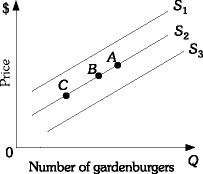 Figure 3.11Refer to Figure 3.11. An increase in quantity supplied is represented by a movement from
A. Point B to Point A along supply curve S2.
B. S2 to S3.
C. Point B to Point C along supply curve S2.
D. S2 to S1.
Answer: A
You might also like to view...
Nominal GDP is calculated by using
A. prices set in a base year. B. average prices in all major cities. C. current prices. D. prices charged by initial producers.
Which of the following is a macroeconomic issue?
A) how a rise in the price of sugar affects the market for sodas B) how federal government budget deficits affect interest rates C) what determines the amount a firm will produce D) the cause of a decline in the price of peanut butter
A person who is switching careers and is unemployed while looking for a better job is an example of
a. Cyclical Unemployment b. Frictional Unemployment c. Structural Unemployment d. Reciprocal Unemployment e. Transitional Employment
Refer to the graph shown. If the government imposed a price ceiling of $4, consumer surplus would: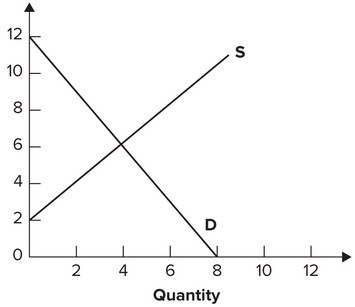
A. fall from 12 to 4. B. rise from 12 to 13. C. be unchanged at 12. D. fall from 12 to 8.