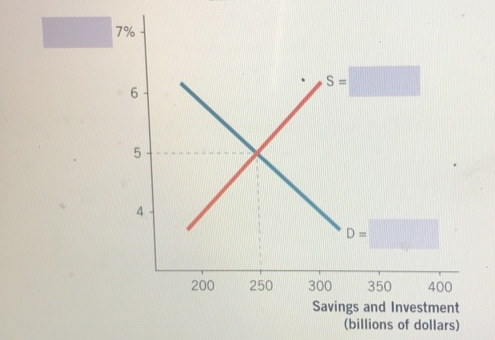
The graph below depicts the market for loanable funds. Complete the graph by labeling the supply and demand curves and the y-axis of the graph.
Answer:
%7 - interest rate
S = Savings
D = Investments
You might also like to view...
A bank has $400 in checkable deposits, $800 in savings deposits, $700 in time deposits, $900 in loans to businesses, $300 in outstanding credit card balances,
$500 in government securities, $10 in currency in its vault, and $20 in deposits at the Fed. The bank's deposits that are part of M1 are equal to A) $1,900. B) $400. C) $1,210. D) $530. E) $410.
Economists define "shortage" as
A) quantity demanded exceeds quantity supplied. B) quantity demanded equals quantity supplied. C) quantity supplied exceeds quantity demanded. D) a situation whereby the prevailing price is higher than the market-clearing price.
Which of these would NOT be considered a middleman in a market?
A) a produce wholesaler B) an apple farmer C) a smartphone retailer D) a fruit distributor
During the financial crisis associated with the Great Recession, the interest rate spread between Treasury bills and bank-to-bank lending increased substantially
a. True b. False Indicate whether the statement is true or false