Which of the following is the best interpretation of the graph below of mussel size (x-axis) versus energy gain (line graph, left y-axis), and number of mussels eaten per day (histogram, right y-axis)? 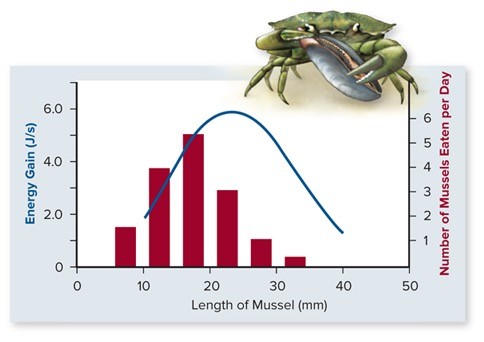
A. Crabs select mussels in a way that maximizes their energy gain.
B. Mussel size does not seem to be a good predictor as to which mussel hungry crabs will select.
C. Crabs prefer the mussels with the smallest length for their food resources.
D. Mussels are selected as food sources by crabs.
E. Crabs tend to consume most of the largest mussels.
Answer: A
You might also like to view...
Hypoglycemia, or low levels of glucose in the blood of a healthy human, is "corrected" by a(n) _____
A) increase in the secretion of insulin B) increase in the secretion of glucagon C) increase in the secretion of both insulin and glucagon D) decrease in the secretion of both insulin and glucagon E) increase in the secretion of thyroid hormones
The mutated gene that causes cystic fibrosis is ____
a. CFTR b. CRFT c. CTFR d. CRTF e. CFRT
Streptococci, the bacteria responsible for strep throat infections, is classified within which group of Bacteria?
a. spirochetes b. cyanobacteria c. alpha proteobacteria d. epsilon proteobacteria e. gram-negative bacteria
If a cell contains large amounts of rough endoplasmic reticulum (ER), then
A) membrane lipids could be produced by that cell. B) digestive enzymes cannot be manufactured by that cell. C) membrane proteins and phospholipids are lacking in the cell. D) large amounts of protein hormones could be produced and exported by the cell. E) few, if any, enzymes for biochemical processes are manufactured by that cell.