A(n) ________ is a visual depiction of a population distribution created by the Analysis ToolPak.
A. histogram
B. ANOVA
C. correlation coefficient
D. mu
Answer: A
Computer Science & Information Technology
You might also like to view...
In databases, a data category is called a ________
A) table B) worksheet C) record D) field
Computer Science & Information Technology
________ are generally used to create worksheets or workbooks with consistent structure and format
Fill in the blank(s) with the appropriate word(s).
Computer Science & Information Technology
After the fill handle is used to copy cell content, the ________ button appears to the right of the selected cells
A) Quick Copy Options B) Auto Fill Options C) Quick Fill Options D) Fill Handle Options
Computer Science & Information Technology
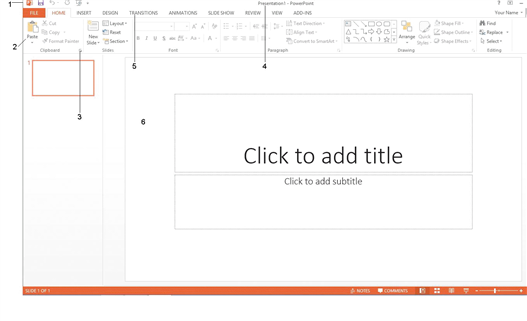 In the accompanying figure, item 3 points to the ____.
A. Aspect theme B. Dialog Box Launcher C. Mouse pointer D. Ribbon
Computer Science & Information Technology