Researchers estimate QALYs in a number of different ways. One popular approach is called:
a. the probability approach.
b. the standard measure of well-being.
c. the utility of life approach.
d. the standard gamble.
e. the QoL approach.
d. the standard gamble.
You might also like to view...
Suppose that some firms in a competitive industry are earning zero economic profits, while others are experiencing losses. All else equal, in the long run, we would expect the number of firms in the industry to
a. increase. b. decrease. c. remain the same. d. We do not have enough information with which to answer this question.
Refer to the accompanying table. Based on their comparative advantages, Pat should specialize in ________, and Corey should specialize in ________. Pizzas Made Per HourPizzas Delivered Per HourCorey126Pat1015
A. both making pizza and delivering pizza; neither making pizza nor delivering pizza B. delivering pizza; making pizza C. making pizza; delivering pizza D. neither making pizza nor delivering pizza; both making pizza and delivering pizza
Refer to the information provided in Figure 6.1 below to answer the question(s) that follow.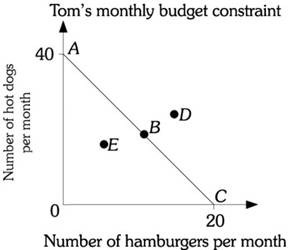 Figure 6.1Refer to Figure 6.1. Tom's budget constraint is AC. His choice set includes all points
A. along the vertical and horizontal axes. B. along budget constraint AC. C. bounded by the area OAC. D. to the right of budget constraint AC.
Refer to the information provided in Scenario 36.3 below to answer the question(s) that follow.SCENARIO 36.3: Consider a local high school that has 300 sophomores considered to be at-risk students. A privately-sponsored after-school sports program has been established to try to help at-risk students succeed in finishing high school. The local government wants to know if this program reduces the students' probability of dropping out of high school before the end of their junior year, and decides to randomly sample 150 of the 300 at-risk sophomores and invite them to attend the after-school program at no cost. 100 students accept the invitation, and by the end of their junior year, the drop-out percentage of the 100 students who attended the program was lower than the drop-out percentage of
the 200 students who did not attend the program. Refer to Scenario 36.3. Based on the information in the scenario, the 100 students who accepted the offer to attend the after-school program is an example of A. positive correlation. B. survivor bias. C. a random sample. D. selection bias.